Service · Web GIS viewers
Custom web GIS viewer development
A web GIS viewer turns scattered geographic data into a map the team can query: layers, filters, territorial context and download. At GearsMap we design and build them to fit each operation.
What we build
We develop custom web GIS viewers to visualize and analyze geospatial information interactively and dynamically.
- Interactive map viewers built with Mapbox, Leaflet or OpenLayers
- Integration of complex data layers
- Drawing tools
- In-browser spatial analysis
- Advanced filtering
Viewers already in use
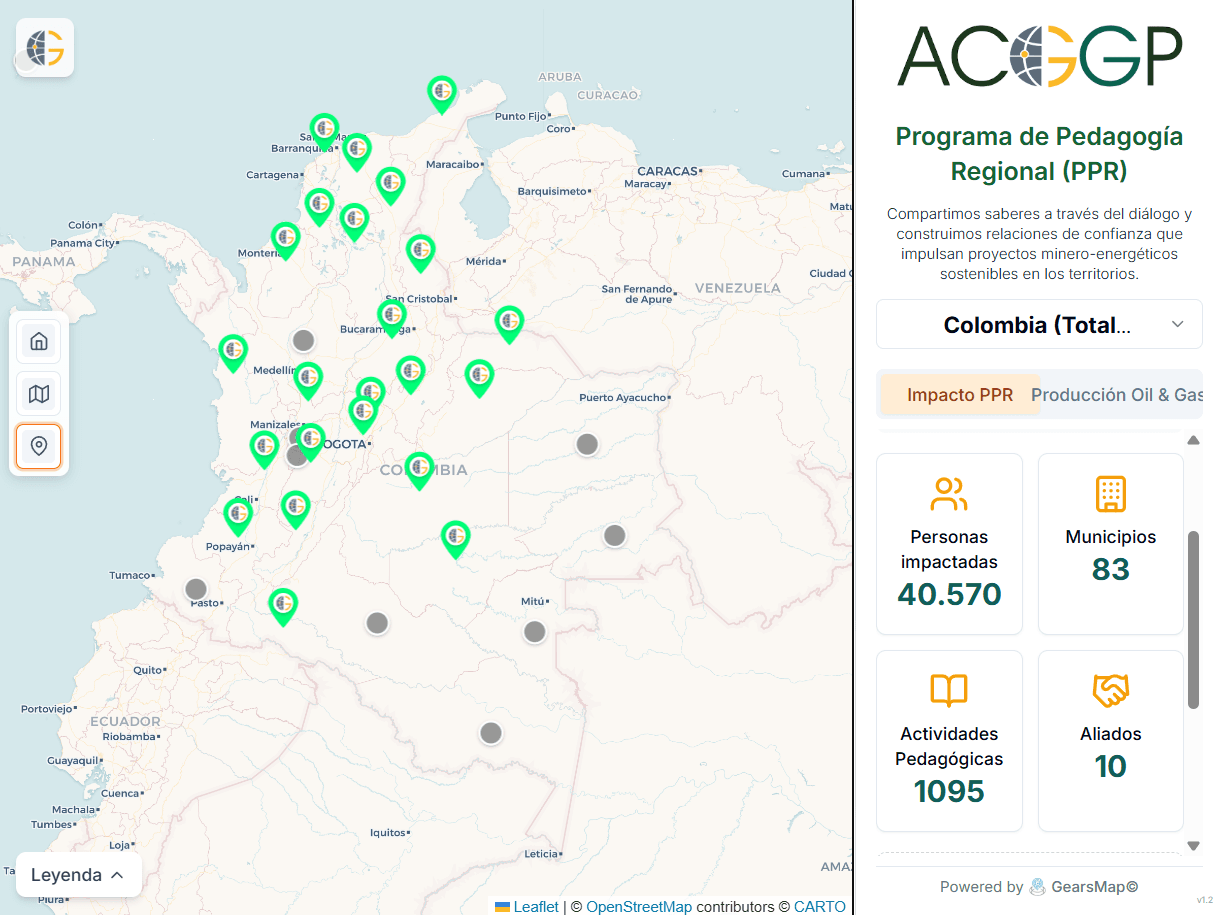
Visor PPR ACGGP
Web GIS viewer for ACGGP's Programa de Pedagogía Regional (PPR), used to explore regional information with layers, filters and territorial context.
Departmental emissions viewer · MRV module
The MRV module of the mining and energy sector's climate information system includes a geographic viewer with a departmental reading, alongside the emissions and intensity dashboards.
Territorial and energy-infrastructure viewers · M&E module
The M&E module includes a territorial viewer of hazard, vulnerability and risk across the country's municipalities and a viewer over mining and energy infrastructure.
The MRV and M&E viewers are part of institutional systems with no public access. This page describes GearsMap's implementation work; it is not an official publication of the Ministry of Mines and Energy and does not imply institutional endorsement.
How we work
A clear cycle from a difficult question to a tool your team can use.
01
Understand the territory
We frame the question, sources, and decisions that need better information.
02
Shape the system
We design the data model, experience, and flows that connect people.
03
Put it in motion
We deliver a useful, measurable platform ready to evolve with the operation.
Technologies
- Mapbox
- Leaflet
- OpenLayers
- QGIS
- PostgreSQL
- React
- Next.js
- Python
Frequently asked questions
What is a web GIS viewer?
It is a web map application that brings together layers of geographic information so they can be queried, filtered and analyzed in the browser. It turns scattered data into a map the team can use, with territorial context and download.
Which technologies do you use to build web GIS viewers?
We build the viewers with Mapbox, Leaflet or OpenLayers, and work with QGIS, PostgreSQL, React, Next.js and Python to prepare the data, serve it and build the interface.
Do you have web GIS viewers in production?
Yes. The Visor PPR ACGGP is in production at acggp.gearsmap.com. It is a web GIS viewer for ACGGP's Programa de Pedagogía Regional (PPR), used to explore regional information with layers, filters and territorial context.
Do you build viewers for climate or mining and energy information?
Yes. The operational implementation of the MRV and M&E modules of the mining and energy sector's climate information system, with Colombia's Ministry of Mines and Energy and KfW support, includes a departmental emissions viewer, a territorial hazard, vulnerability and risk viewer, and an energy-infrastructure viewer. They are institutional systems with no public access.
What happens after delivery?
We can continue with monitoring and maintenance of the viewer to keep it working well over time.
Does your team have geographic data it still cannot query?
Tell us what data you have and which decisions the map should support. We will work out with you how to build the viewer.